Risk adjusted returns of investments and variance analysis used in corporate finance and accounting will both depend on understanding some basic concepts and equations. This discussion will assume that its readers understand and can calculate the three measures of central tendency (mean, mode, median) as well as the range for given data.
Slightly more involved are calculations of variance itself, standard deviation (simply the square root of variance) and the mean absolute deviation.
Variance
As always, don’t let the equations intimidate. We’re going to break it down. Let’s start with the variance, given by this equation:
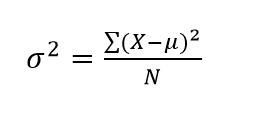
Stated in plain english, variance is equal to the summed squared deviations around the mean divided by the number of observations in the population. So we take each observation, subtract the mean from it and square the result. We do that for every observation and then add them all up (this is the numerator). Then we divided by N, the number of observations.
Sample size works similarly, only the notation changes and we now subtract one from the number. Have a look:
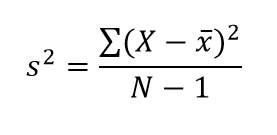
Notice that we’re now using what appears to be an “s” squared. Helpful, because it enables us to easily recall that we’re using sample variance instead of population variance. The figure used for each observation, X, hasnt changed. However, the figure used for our mean has – again this is to differentiate between population and sample means. Finally, we subtract one from the number of observations.
Thus we have the Variance. From here, it’s easy to understand standard deviation (or vice versa, actually). Let’s start with population standard deviation:
Standard Deviation
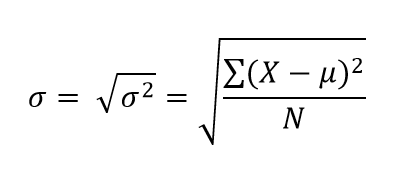
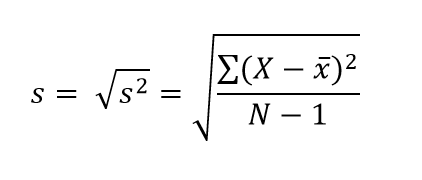
It’s just the square root of population variance! Sample standard deviation follows the same protocol, and maintains the same changes in its notation:
Mean Absolute Deviation
Finally, let’s take a crack at mean absolute deviation. Personally, I this one sounds the most difficult – but its probably the simplest in reality.
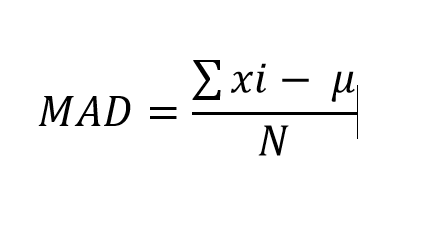
To calculate MAD (cool acronym) we just add up all of the deviations from the mean (each observation, shown as “xi”, minus the mean gives you a deviation), then divide the resulting figure by the number of observations.
With a grasp of these tools you can begin to conduct basic risk analysis for all sorts of applications within finance – investments, project costs or income, etc.
We’ll get into some applied examples of these five tools, as well as their slightly more complicated uses in more advanced risk analysis this coming week.