Arguably the simplest approach towards generating normal distributions using pseudo-random numbers is through a combination of RAND and Norm.S.Inv.
Norm.S.Inv will return the inverse of the function Norm.S.Dist. Norm.S.Inv takes one argument which must be a probability between 0 and 1, and returns a number that is standard normal. Thus when we place RAND inside of Norm.S.Inv, as in writing “=Norm.S.Inv(RAND())” in a cell, we can effectively coerce the pseudo-random number into one that is standard normal.
Example:
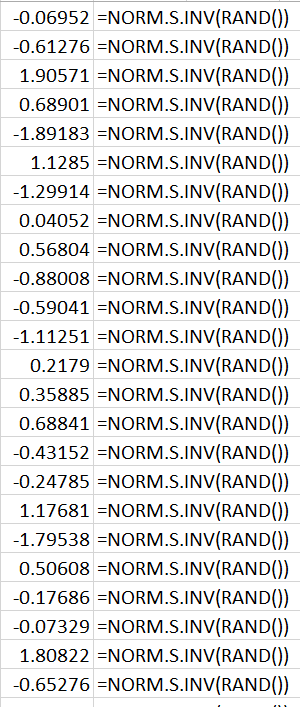
The formula shown in the right hand column of cells above was entered into just under 200 cells (left hand column) to give a good enough sample size for our purposes, as you can see RAND is placed inside NORM.S.INV.
To take a first glance at the data, we can just plot these figures:
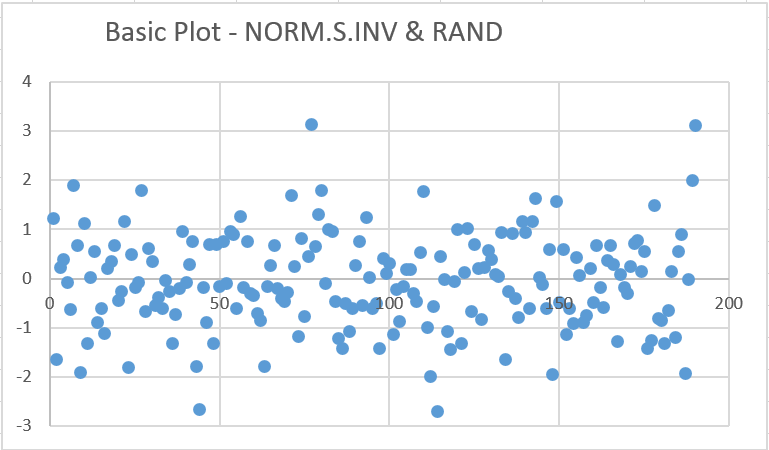
Technically we have accomplished our stated goal of generating normal distributions in Excel. If you look closely at this data, taking note of maximum and minimum values (approximately 3 and -3), you can see that there are few outliers and density appears to increase as the values get closer to zero. This is hardly the ideal way to look at the distribution, however.
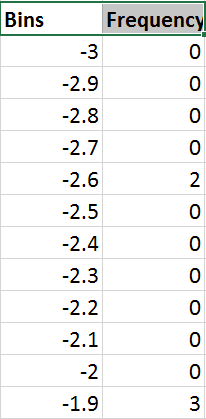
Let’s set up some bins real quick running from -3 to 3 with intervals of .1. This is what the first few rows look like, stretching all the way to positive 3:
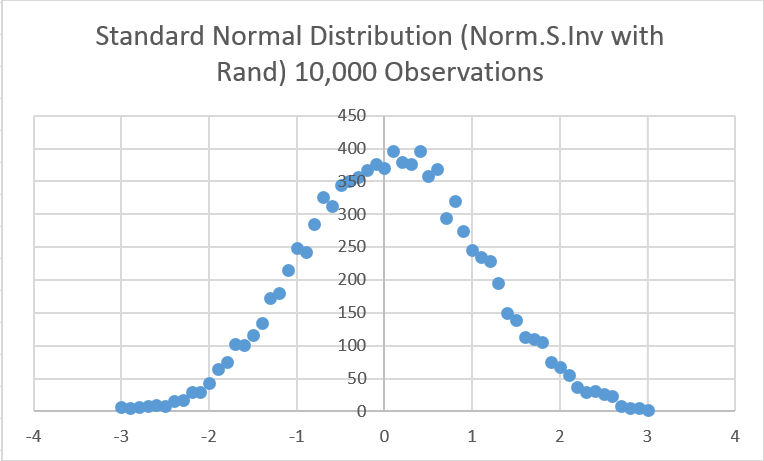
Highlighting those cells and inserting a simple scatterplot with default settings gives us the following plot, which is beginning to generally look like a standard normal distribution generated by our series of random numbers:
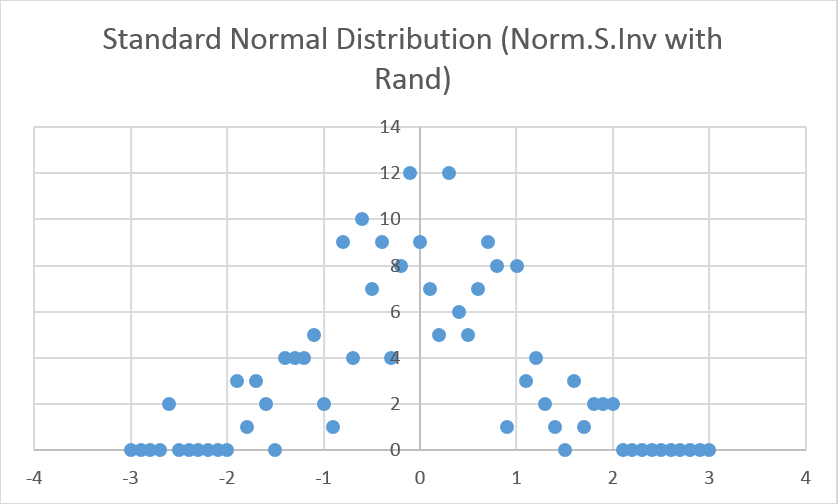
A sample of 200 though, means that we’re getting a lot more noise in the interior of the plot than we might otherwise expect in a beautiful standard normal distribution. Increasing the sample size makes the picture a little more conclusive, here’s 10,000:
We can use the function Norm.Inv in a nearly identical way. The only difference is that unlike Norm.S.Inv, which does not require any input for mean and variance (within a standard normal distribution, mean is assumed to be zero and standard deviation is assumed to be one) we have to specify those parameters for Norm.Inv.
Example function with a mean of 8 and a sigma (aka standard deviation) of 10:
“=Norm.Inv(Rand(),8,10)”
Go ahead and give it a try!