When it comes to Excel, the phrase “there’s more than one way to skin a cat” applies in almost every situation. Today we’re going to take a look two separate ways to accomplish the same important task: building frequency distributions.
Setting up Bins:
![]() To start out with, I created a data set of numbers from 1 to 7. There is exactly one number one, two number twos, three number threes, etc, all the way until there are seven number sevens. This makes it easy for us to verify that we’ve created our distribution correctly – when we’re done, we should easily see that our formulas are counting four number fours, etc. I’ve shrunk that dataset off to the left.
To start out with, I created a data set of numbers from 1 to 7. There is exactly one number one, two number twos, three number threes, etc, all the way until there are seven number sevens. This makes it easy for us to verify that we’ve created our distribution correctly – when we’re done, we should easily see that our formulas are counting four number fours, etc. I’ve shrunk that dataset off to the left.
Our first step in building frequency distributions today is create our “bins“. Bins are just the way we’re slicing the data into segments based on its values. So, if we want to count the number of observations that are less than or equal to 4, our first bin would be 4. If we also wanted to see the number of observations greater than 4 and less than or equal to 8, our next bin would be 8, and so on. We want to be sure to include all our our data points unless we have a good reason not to.
For the sake of simplicity we’re going to use bins that are 1 unit wide, so 1 is a bin, 2 is a bin, 3 is a bin, etc. we’re going to use the very useful COUNTIF formula.
COUNTIF takes two arguments (inputs). First, it accepts a cell or range that excel is going to look at. Second it takes the condition. This can be a value like 1, in which case excel will look at the cell or range you specified and count up each cell that is equal to 1.
We can also insert a cell reference like A1, in which case excel will count the cells in your range that are equal to whatever is in A1. Check out the formula we use and see if you can make sense of it:
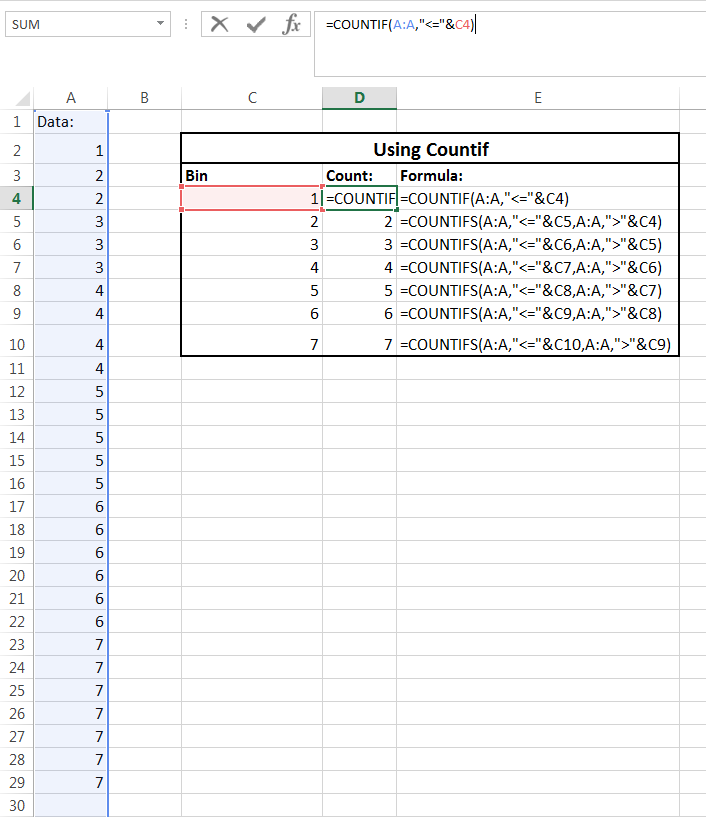
As you can see, I’ve entered a list of bins for our data from 1 to 7 in column C. In the next column, D, I have the formula to count the number of observations that fall into each bin. Column E is showing the formula in use in the cell to its immediate left.
In D4, to count the number of observations in the first bin the formula is: =COUNTIF(A:A,”<=”&C4)
Using COUNTIF:
The COUNTIF formula says to excel, “count the number of cells in the entirety of Column A that are less than, or equal to, the value in C4“. Notice that the “less than or equal to” is placed in quotation marks, and is followed by the & sign. In Excel, “&” is used to concatenate or combine strings. This symbol is NOT equivalent to the AND formula (which is used in logical statements) – it is to combine strings, not to specify two conditions in a logical statement.
Here, & is followed by C4. Attempting to write “<=C4” into a COUNTIF formula will throw an error. Excel demands that the cell reference be place outside of the quotation marks, and that it has to be concatenated (done here with &) in order for the function to read the value correctly.
So, now we understand how to use one of the most useful functions in Excel and we’ve set up our first bin! The next bin is a little trickier though. Recall that the first bin we used was just values equal to or less than the bin (in this case, 1). Other bins on the other hand (2 through 7) have two criteria: they must be greater than the bin immediately lower and must be less than or equal to the bin itself.
Take the bin of 2 for example, we need to only count observations that are greater than 1 (the bin that is immediately lower than 2), AND are less than or equal to our bin of 2. Unfortunately, COUNTIF doesn’t natively support multiple conditions. Luckily, its companion function, COUNTIFS, does and follows very similar guidelines as COUNTIF.
The arguments for COUNTIF and COUNTIFS are as follows:
COUNTIF(range, condition)
COUNTIFS(range1, condition1, range2, condition2,…)
Building frequency distributions using COUNTIFS:
As you can see, COUNTIFS just allows you to repeat the process of naming a range and a condition specific to that range more than one time. Check it out: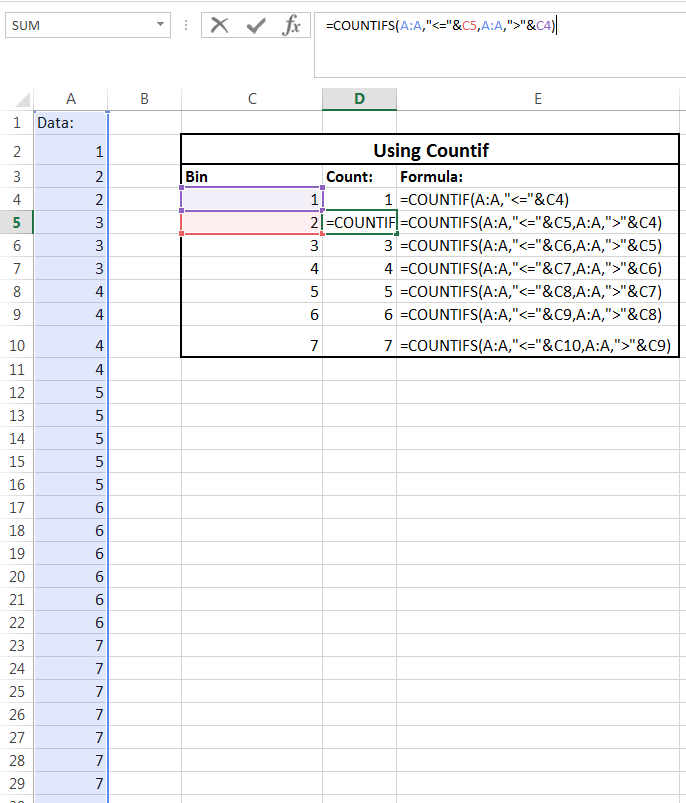
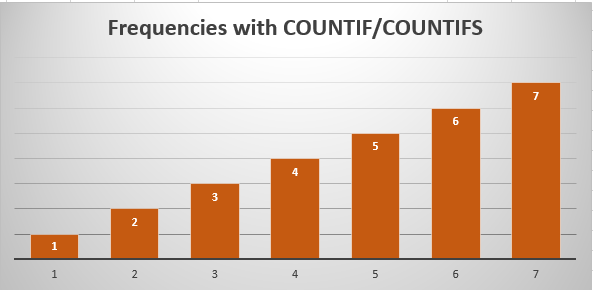
The range stays the same, but we’re able to specify the first condition as well as a second. As you can see, the formulas are returning the correct number of observations in each bin. Our data has seven observations that are greater than six but less than or equal to seven, six observations that are greater than five but also less than or equal to six, etc. The last step is to produce a quick visualization of our data so that it is easily and intuitively understood at a glance:
Avoid Solutions Like This:
This is just one way to go about building frequency distributions – and not necessarily the most flexible. Notice that our first bin only needed one condition, but the ones that followed it all needed two – this means that we need to use two sets of formulas. There is a workaround for this issue – like almost any problem one encounters while working in Excel. Just for fun, I created one such workaround that enables you to use just one formula and drag it across all your bins.
The problem goes back to a key tenant of this site – KISS. Simple models are usually better models. Moreover, equally important to having a good model is having one that other people can understand, alter, recreate and make decisions based on. You can immediately see formulas of this length are a pain if you didn’t write them, and sometime even if you did:
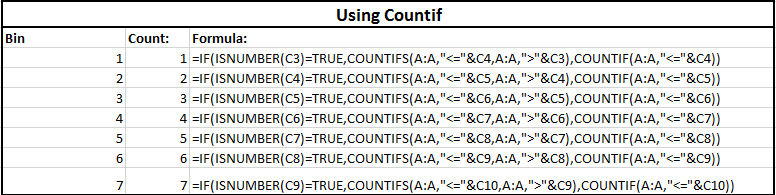
Can you figure out what this formula is telling excel to do? If you’re unfamiliar with IF statements, check out a quick primer here (coming soon!)
Part II is going to look at a more elegant and simple solution, Excels built in FREQUENCY function.